Thursday, July 30, 2009

Poll: Obama approval rating slipping in key areas

READ STORY HERE
Hardly anyone assumed the first several months of Obama’s Presidency would be easy, but lately things are looking downright difficult.

Surrounded by his embattled health care reform proposals, decidedly mixed economic data and a minor racial controversy the President has seen his approval numbers dip to the point where his administration might have to start taking notice. Although negative feelings aren’t being felt across the board to the same degree in which they plagued most of President Bush’s second term, “Obama Mania” has certainly subsided while the voices of opposition number greater and grow louder.

The cumulative average of ten recent polls taken since mid-July place President Obama’s approval rating at 55%. While this is still a positive number the media focus is all about momentum, and in terms of momentum 55% marks a sharp decline. It’s quite possible that the bottom has not been reached yet either. Gallup has Obama at a 52% approval rating with his negatives reaching 41% - both far and away the worst numbers of his young administration.

The news out of Rasmussen Reports is even worse President. Surveying “likely voters” instead of registered voters or general adults as most polls do, Rasmussen has the President’s approval at 48%. Furthermore, the number of those strongly disapproving of the job he is doing outnumber those who strongly approve by 12%, also the worse disparity yet for the Obama administration.

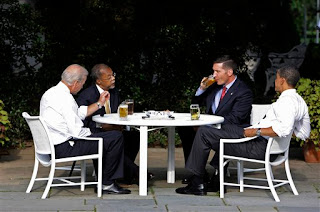
Lately bad news has proven easy to find and a difficult landmine to sidestep for the administration. Across the board polls show that at least a plurality of adults consider President Obama to have mishandled the racially tinged dispute involving the arrest of black Harvard professor Henry Louis Gates Jr. by white officer James Crowley. Obama admitted to have chosen his wording poorly and planned to have both men attend the White House for a casual outdoor discussion. Press Secretary Robert Gibbs was bombarded with questions recently about the issue and the President’s falling approval ratings, dismissing the latter as unimportant.

Surprisingly perhaps modest gains made by the stock market in recent weeks and the imminent confirmation of hand picked Supreme Court Judge Sotomayor to the Supreme Court have apparently done little to boost Obama’s favorability. Some columnists such as Dan Balz of the Washington Post and Katie Connolly of Newsweek question the validity of numbers as relating to an actual decline in support for the President however. Balz took note of a focus group of mildly dissatisfied but still optimistic independents. Connolly in her piece pointed towards a PR struggle and the mere perception of negativity over actual negativity toward the President and his policies.

Perhaps what these polls show most clearly is that Obama hasn’t been specific enough in his plans, especially while his opponents have been so explicit in their criticisms. He’s losing because he’s combating particulars with generalities. When respondents are answering questions about “Obama’s plan,” it’s still not even clear what that plan is. The president certainly hasn’t detailed it. In this debate, specifics will always prevail over abstractions, but fortunately for Obama, that’s not such a hard problem to remedy. – Katie Connolly (Newsweek)


Still it’s hard to ignore the anatomy of what makes up Obama’s declining overall approval ratings. The proof may just be in the pudding after all - some examples below.

* 50% of likely voters expect the quality of health care to decline if reform is passed by the President and Congress - Rasmussen
* An equal number (46-46%) approve and disapprove of the way the President is handling health care policy – Time
* 41% of respondents disapproved of the way President Obama handled the Gates arrest compared to 29% who approved - Pew
* Just 39% approve of the way the President is handling the federal budget. That’s a ten-point drop in three months - AP-GFK
* By a margin of 49-47%, more adults disapprove of the way President Obama is handling the economy than approve – USA Today
* An even number of those (24% ea.) are very confident or not confident at all that Obama can “bring about real change to the way things are done in Washington” - Diageo/Hotline
* Since entering office only 32% of voters think things have gotten better under Obama. 30% say they have gotten worse, and 37% say they’ve stayed the same – Quinnipiac
* In the month of July consumer confidence has been at an average index level of (-50) – ABC News

Tuesday, July 28, 2009

Poll: Public lacks confidence in Congressional understanding of health care reform

READ STORY HERE
The American public is divided on the issue of health care reform. Regardless as to what side of the ideological fence they sit most are not confident that Congress has a grasp on the issue.

The most recent Gallup poll on the topic finds that many American citizens while admittedly do not have a strong understand of the complexities of health care reform, they are even less confident that their leaders do. 48% of adults suggest they have a good understanding of the issue against 51% who feel they do not. By a whopping disparity only 27% think Congress has a good handle on health care as opposed to 66% who think they disagree.

Such a low percentage corresponds with just 17% of American voters who claim to have high confidence in Congress. Interestingly a deeper look into Gallup’s numbers indicate that by a 35% plurality most voters in this latest survey feel that neither they nor their politicians have a good understand of the health care reform topic.

Less than a week ago another Gallup survey indicated no clear consensus on the on the desire for health care reform. Although 71% favored some sort of new legislation, far less than half (41%) considered it high enough a priority that it needs to be passed before the end of 2009, and 29% are either unsure or don’t not want it passed at all. Using some particularly strong wording the Kaiser Family Foundation randomly sampled over 1,200 adults earlier this month. Their findings showed that while a majority of Americans (56%) want the government to “take on health care reform right now”, a growing number of people (39%) do not think our country can afford to tackle the issue.

Whereas confidence in Congress on a variety of issues - health care included - is at historic lows, the confidence Americans have in President Obama handling the issue has also slipped. According to a two-week old ABC/Washington Post poll less than 50% approve of the President’s handling of issue. His approval to disapproval split of just five percentage points (49-44%) is down from a fourteen point margin in mid-June.

Pessimism about the effectiveness of health care legislation is also conveyed in two recent polls from the previously mentioned Kaiser Family Foundation and Rasmussen Reports.

A majority of Americans (53%) think that the passing of a new health care plan either would make things worse off or keep about the same. This includes topic ranges from the quality of care, cost, choice of doctors and hospital waiting times. Only when asked the question of whether the country as a whole would be better off with health care reform do a majority (51%) of Americans think new legislation would make things better according to the Kaiser Family study.

Rasmussen who has shown particular negative numbers for Obama and the Democrats as of late actually indicates that 49% of voters are against the new reform proposals brought forth by the President and Dems in congress. This against just 47% who favor the measure. Just 23% of voters believe new legislation will lead to lower costs against 53% who say medical treatment will become less affordable.

While it seems a bipartisan effort is now underway hammering out the details of new legislation for health care reform, convincing the masses that a new program will be a better program presents a different challenge all together.

Sunday, July 26, 2009

ESPN SportsNation: polling for fun if not for facts

READ STORY HERE
The intrigue and influence associated with opinion polling is not lost on the folks at ESPN – the worldwide leader in sports.

ESPN has been virtually bombarding webpage visitors with splashy, albeit highly unscientific poll questions for years now. Using the “Sports Nation” moniker to classify the range of opinions from fans across the country the ESPN Empire has adapted a new show based on the results to their varying poll questions. The show is hosted by television personality Michelle Beadle and ESPN satellite radio host Colin Cowherd.

Looking to create a show that is primarily the product of the fans, those who tune in not only can vote on poll questions but also propose topics through phone calls, email or Twitter. Taking a look at the SportsNation homepage you’ll see topics ranging from Michael Vick’s suspension and Tim Tebow’s celibacy to fan blogs, videos, reporting and of course poll questions.

Many web publications have inserted poll questionnaires in the past, often referred to as straw polls. ESPN took things a step further however by associating a map layout of the United States to show not only how many of the votes were going to a particular response, but in which states topics and answers were getting the most play. Consider it ESPN’s virtual electoral map of sorts.

It’s fun, it’s flashy and it’s interactive. It’s also as previously stated, highly unscientific. First off according to ESPN.com’s very own press kit 94% of its registered users are male. While its probably unfair to assume that the percentage off all ESPN.com visitors are also male by at such a high clip, it’s equally far fetched to believe that female sports fans by the numbers are being equally represented by SportsNation.

ESPN online polls do not weigh their samples either meaning the series of important demographic and ideological factors obtained by responsible scientific polls are tossed out the window. Thirdly there are unbalanced sample sizes from state-to-state and a varying number of total responses from one poll to the next. More general questions from popular sports such as, “Which team do you think will win the Super Bowl?” will naturally generate more votes than a question on rule changes in professional lacrosse. At the state level more Pennsylvanians for instance are likely to chime in on a topic that includes an athlete or team, say Sydney Crosby or the Eagles, from its own backyard than ones that do not.

It could be said that this is no different of course than the number of those who vote in Presidential elections as opposed to the substantially lesser turnout for midterms.

One question on ESPN’s SportsNation home page asks fans what they think the current state of NASCAR is? Four possible responses (excellent, good, acceptable, troubled) follow an article written about the sport’s lackluster appeal of late. For those undecided or influenced voters the story could create a push-poll tendency that would take an otherwise “acceptable” response to “troubled”, or “excellent” response to merely “good”, and so forth.

The poll had 17,395 responses as of noon this Saturday. By a plurality 47% chose “troubled” as the best way to define the current state of NASCAR racing. 27% were inclined to vote it as being “acceptable”, 19% for “good” and just 7% for “excellent”. While 17,395 appear quite large for a sample, from one state to the next the totals vary considerably. 1,622 Californians voted for instance against just a total of fifteen from the least populated state of Wyoming.

Not surprisingly perceptions of NASCAR generally did best in the Deep South where the sport is most popular. 38% of the 192 voters in Alabama said the sport was in “good” shape – the only state issuing a plurality of positive responses. Northeastern and western states where NASCAR is not generally as popular received harsher treatment by and large with most states having a majority of voters considering it to be “troubled”.

Just as in any poll odd questions will also generate odd responses. Here’s one of nearly 17,000 votes asking SportsNation viewers if they think the Pittsburgh Pirates are “bad” for baseball. Terms like “bad” are incredibly ambiguous for starters and made even more roundabout by the two choices given to online voters. Question one says vote “yes” if you think they aren’t trying to win, whereas question two says vote “no” if you agree they have a plan to build. 54% of responders voted “yes”, but does this mean they really think the Pirates are bad for baseball or that they just agree with the answer selection that the team doesn’t seem to be trying their hardest to win games? Where are those voters who think the Pirates aren't bad for baseball but also aren't really trying to win accounted for?

Fortunately no one with more than a pedestrian understanding of opinion polling is going to place much stock in the straw polls of ESPN or the top-line results from SportsNation. In the meantime the ESPN polls are fun and noteworthy for the massive amount of responses they receive, the state-by-state breakdowns they show and the often-amusing questions they ask. So enjoy, just don’t look into it.

Thursday, July 23, 2009

Poll: Rendell approval rating slips in Pennsylvania, but by how much?

READ STORY HERE

Six and a half years in as Pennsylvanian Governor, Ed Rendell is now facing perhaps the steepest uphill battle of his term.

A recent Quinnipiac poll suggested that problems with the state budget and Rendell’s heavily unpopular call to raise the income tax has shifted his approval rating from 54% to 39% in just two months. Painful economic times have cost even many of the most popular politicians from across the country, but Rendell’s dramatic fall over such a short period of time points as much toward the man himself as it does his affiliated job title in this crisis.

For starters here are some of the highlights from the Quinnipiac poll. We’ll delve our way into the flaws of this survey in just a minute.

By a nearly two-to-one ratio Pennsylvania voters reject the raising of income taxes even temporarily to help balance the budget. Just as alarming, 90% of Pennsylvanians consider the Governor and State Legislature’s inability to come up with a budget by the long since passed June 30th deadline a “serious problem”. As far as who deserves most of the blame, more voters point the finger at Republicans (17%) in the State Legislature than Democrats (11%), but Rendell receives 30% of the blame against an additional 28% who blame all sides equally.

Rendell’s proposal to raise the state income tax from 3.07% to 3.57% for three years gets support from only around half of Democrats and is wildly unpopular with independents and Republicans. Interestingly by a 62-24% margin most Pennsylvanians think that if there has to be a tax increase of any sort, let it be a hike in the state sales tax. Such a move could be beneficial to those living in the Philadelphia area where much “expensive” shopping is done across state lines in the tax free zone of Delaware already.

Now lets turn our attention from the problems facing Governor Rendell to some of the issues with this specific poll.

Firstly we ought to commend pollsters like Quinnipiac who put the sort of time and dedication into state level polling such as this. Take their sample size as indication. Many national polls do not gather responses from 1,173 voters let alone polls conducted at the state level. That said Quinnipiac’s flaw is not accounting for actual registration totals from the state of Pennsylvania into their sample distribution.

In this poll there were nearly as many Republican voters surveyed (511) as Democrats (512). The 150 filling out the “other” category made up 12.8% of this poll. That isn’t entirely inaccurate from Pennsylvania State Department totals showing registered independents at 11.8%. But the same State Department figures also indicate that currently Democrats outnumber Republicans in terms of registration in Pennsylvania by a margin of 51-37%, not the virtually identical 43.6% depicted here by Quinnipiac.

What we are seeing here then is a skewed depiction of Rendell’s performance with Pennsylvania voters towards the negative side. Take the Governor’s approval rating as an example and reapply the State Department numbers. From responses to the Quinnipiac poll we know that Democrats approve of Rendell’s job performance by a 58-34% margin. We also know that Republicans and independents disapprove by margins of 20-74% and 37-55% respectively.

State Department totals would tell us that the Governor’s overall approval rating should be closer to the neighborhood of a 42-48% split, not the 39-53% being reported by Quinnipiac. While this shows a considerable drop in support for the Governor, from a (+17%) rating in May to a (-6%) or (-7%) rating in July it is not quite the (-14%) plummet being depicted in this poll. As always, consider the source.

Tuesday, July 21, 2009

Poll: 40 years later most Americans approve of NASA, space program

READ STORY HERE
Recent polls taken as we celebrate the 40th anniversary of the Apollo 11 moon landing suggest that most Americans still are on board with the space program.

An interesting if unscientific Space.com poll showed 82% of that website’s nearly 7,000 responders in favor of sending astronauts back to the moon. Surely an overwhelming number of that site’s visitors would too be in favor of programs that push beyond the moon into the farther reaches of the solar system and galaxy. In tough economic times it might stand to reason that the majority of the American public would at best lukewarm at the prospects of billions of government dollars spent to reach the next frontier.

Has the space program lost its luster? A recent Pew Research Center poll would suggest the answer is ‘yes’ at least to an extent. When the asked the question of what is America’s greatest achievement of the 20th century ten years ago a healthy 18% of responders mentioned the Apollo 11 moon landing. When asked a similar question this past May about the greatest achievement of just the past fifty years only 12% now place landing on the moon at the top.

That said a recently Gallup survey shows plenty for NASA and the space program to be pleased about when it comes to their public image. 58% of responders to a poll question agreed that the benefits of the space program have justified the overall costs. This figure has shown a noticeable increase over the years since the Apollo 11 mission four decades ago. In 1980 for instance only 41% felt the costs were justified and in 1995 that number was still less than half (47%).

According to the Gallup survey the support for space program spending has bounced around a little over the years but the number consistently remains high. Currently 60% feel that spending on the space program should either be increased or at least kept at current levels. This figure is actually down considerably from a 75% clip in late-2003 but up from a low of 46% in late-1993 and some would suggest impressive considering current economic conditions. Furthermore those who think that NASA is doing a good or excellent job also continue to score with the American public. Their overall approval ratings have consistently been over 50% since the mid-90s and currently sit at 58%.


ABC News conducted a poll asking various space related questions a year and a half ago. Using rather roundabout terminology the poll found nearly two-thirds of responders think it probable or definite that “ordinary” people will travel in space in the “years ahead”.

That doesn’t mean that most Americans themselves are comfortable with the idea of space travel or living abroad in the galaxy however. Only 39% said they would travel in space if the option became available to them and only 38% think NASA should be looking to create permanent settlements located beyond Earth. The ABC poll also finds a considerable majority of the public believing in intelligent life in outer space. The margin of those believing to not believing (55-37%) holds virtually unchanged from a decade earlier.

Have conspiracy theorists gotten to enough of the American public to shift views on the first moon landing and the space program at large? Not really according to polls. In the late 90s polls taken by Gallup and CNN/TIME revealed that only about 6% of the American public believed at least the first moon landing to be a hoax. That’s far less than a 2000 poll that suggest 28% of Russians did not believe the moon landing to be true or the 25% of Britons in a survey conducted just two weeks ago who do not believe that event to have taken place.

CBS backs up previous less conspiracy riddled polls showing that Americans seem to take pride in the moon landings and are generally in favor of major space projects. There are identical results to two polls taken ten years apart asking whether those responding think the first moon landing was worth the costs or not. 71% who say it was worth it looking back now, 24% who disagree and another 5% who remain uncertain.

The numbers aren’t especially gaudy when asked whether the U.S. space program has achieved more, less or about what “you” expected since the first moon landing. The CBS poll reveals only 27% think NASA and company have exceeded expectations against 32% who say less has been accomplished than expected.

Lastly there seems to be conflicting data regarding public opinion on the topic of what is perhaps the next major space-age program. According to the aforementioned CBS poll by a 51-43% margin poll responders are in favor of sending astronauts to explore the planet Mars. CNN/USA Today however shows resistance to a Mars mission in a four year old poll taken of over 1,000 responders. The results of that survey show a 58-40% margin against the U.S. setting aside dollars to engineer a manned spacecraft that would fly to the Red planet. Interestingly even in the midst of “Moonwalk Mania” in the summer of 1969 only 39% of responders to this very same poll considered it worthwhile to invest in a Mars landing.

Friday, July 17, 2009

Polling 101: Why different polls show different results

READ STORY HERE

In 1936 one of the earliest examples of a nationally based opinion poll sought to predict whether Franklin Roosevelt would win a second term as President or if he would be defeated by Kansas Republican Alfred Landon.

The popular magazine Literary Digest released a poll just days before the election, results based on two million responses from questionnaires mailed to their readers. The result of their findings? Alf Landon the victor in a landslide, winner of 370-electoral votes. The actual result? Franklin Roosevelt wins reelection taking all but two states in the most one-sided Presidential Election in history.

It is generally agreed upon that the cause of the Literary Digest mistake and one that continues to haunt pollsters to this day was due to improper sampling. There were considerably more Republican readers of the magazine than Democrats and these questionnaire responders were understandably prepared to cast their votes for Landon over FDR. The disastrous error cost the Literary Digest dearly. Their credibility plummeted overnight and the publication never recovered.

Around the same time George Gallup an advertising executive organized a poll of 50,000 sampled responders and correctly predicted both that Roosevelt would win reelection easily, and that the Literary Digest results would be wrong. Since that time polling organizations like Gallup have played an essential part in elections and in charting public opinion on the issues.

Now in 2009 you would tend to expect that opinion polling would be a sophisticated enough process that most pollsters would show similar results. So how is it that certain polls can show such different results? Here are some examples of the polling process and its difficult task in rendering accuracy.

In the early-summer of 2008 it was widely accepted that Barack Obama was leading John McCain in the race for the White House by a margin of four to eight percentage points. Right around that time however two very reputable publications had the Illinois Senator leading his opponent by margins of 15% and 12%. Those pollsters were Newsweek and the Los Angeles Times and their findings caused quite a stir. Flash forward to late October when a Fox poll showed the Presidential race in a virtual dead heat, strikingly different than the 5-9% spread most other polls were indicating at the time.

How does this happen?

Well it generally takes an in depth look at the polls themselves to uncover where the top-line results generate their totals. Problem is that it is often difficult to find the actual poll report from the publication in question so people are at times at the mercy of the media’s assessment. Generally right leaning columnists will jump to report on a poll that looks particularly favorable to their candidates of choice, just as liberal reporters will thrill to see data that appears kind to their politicians. Even when dealing with something as easily depicted as numerical data, receiving “fair and balanced” reporting on polls can prove elusive.

The term “outlier” has been adopted by pollsters as a way to label polls that are significantly out of step from the average of others showing similar results. That does not mean however that such outlier polls are always flawed or incorrect however, just that they are generally viewed with a healthy dose of skepticism. For an example of what an outlier is lets pretend you took five tests on a subject you were familiar with. Let’s say “American History” was the topic and the results from these tests were made public. Here are the scores below;

Test 1: 92
Test 2: 85
Test 3: 88
Test 4: 90
Test 5: 65

The fifth and final test would be considered the outlier since the score was much lower than the average of the first four. The public would regard the fifth test as a fluke or outlier and assume your knowledge of the subject to be rather high. The teacher however with the answers to each question in hand notices a pattern. The fifth test revolved around a specific topic of American history you were less familiar with and the considerably lower score is testament to that.

Now take a look at the aforementioned poll examples from the 2008 election cycle. Two polls simultaneously released showing wildly positive numbers for Obama and later in the year the Fox poll that indicated a race that was practically tied. A deeper look revealed the answers. LA Times and Newsweek polled a disproportionate number of Democrats and the random sampling used by Fox had nearly as many Republican responders as Democrats. This in spite of data from partisan trends that indicated the number of Democrats outnumbered Republicans nationwide by 6-8% at the time.

Naturally there are other factors that make for “good” and “bad” polls. One such factor takes into account the subjectivity of poll questions, or as many who label them negatively, “push polls”. One of the more infamous examples of how push polls are used was in the 2000 Republican Primary. In an attempt to torpedo Senator John McCain’s campaign the George W. Bush campaign controversially mentioned a possible scandal under the veil of a simple poll question. “Would you be more likely or less likely to vote for John McCain for president if you knew he had fathered an illegitimate black child?”

Sometimes surveys show push-poll tendencies unintentionally. Results gathered from questionnaires are often based heavily on who is asking and how the question is being phrased. Let us use another hypothetical example of how two polls containing similar questions can render wildly different results.

Question 1: In light of the recent Supreme Court overruling of Judge Sandra Sotomayor’s decision to suspend promotions of New Haven firefighters in the Ricci vs. DeStefano case do you approve, disapprove, or are you unsure of her confirmation to the Supreme Court?

Question 2: Judge Sandra Sotomayor has recently come under criticism for her controversial decision to deny New Haven firefighters promotions based on racial bias in testing. In light of the Supreme Court’s overruling of her decision in the Ricci vs. DeStefano case do you approve, disapprove, or are you unsure of her confirmation to the Supreme Court?


Notice the difference in terminology between the two questions. The second in particular makes a point of informing the responder that Judge Sotomayor “has recently come under criticism” and that her decision was deemed “controversial”. The first question makes no such claims and simply lays out the basic facts. If both questions polled Americans equally weighed along biological, political and ideological lines it would not be surprising to see Sotomayor score considerably worse with second question responders being led or “pushed” towards a negative opinion of the nominee.

Lastly for our discussion the simple accuracy of a poll is often dictated by the size of it. Over 130-million Americans cast their votes in the Presidential election last November. Opinion polls however are only able to survey a tiny fraction of those voters at any one time. So long as the polls are weighted properly to reflect the makeup of voters and as many variables as possible, generally the more people you interview the better results.

In North Carolina for example Public Policy Polling surveyed 2,100 “likely” voters, quite large for a normal state poll. This compared with just 600-interviewed by Zogby. While both polls were close to the actual result, the PPP poll showed then Senator Obama leading 50-49% with Zogby showing McCain ahead by a 49-48% margin. Both polls were released two days before the election and the end result showed that the large sample size used by Public Policy Polling may have paid off to the tune of a perfectly accurate prediction.

Just as in regards to political reporting at large, conspiracy theories stretch far a wide regarding polling. That said this writer believes most pollsters to be honest and legitimate in their search for accurate data of public opinion. Some pollsters are simply better and more consistent with the questions they ask, the sample sizes they use, and the data they reflect. Polls are an often arduous time consuming process that lacks perfection in almost every instance. The role that organizations like Gallup and their many offspring play in the shaping of personal opinions, public policy, and the candidates themselves however cannot be understated.

Thursday, July 16, 2009

Poll: Obama approval tied to stimulus, economic outlook

READ STORY HERE
President Obama and Congressional Democrats' economic stimulus package is arguably the “New Deal” of the 21st century. Both ambitious and controversial the plan continues to generate passionate debate from wildly opposing view points on the social and political spectrum.
A new CBS poll indicates that while support for the stimulus may have slipped over time as our country continues to struggle out of its economic rut, the package is still viewed positively by a majority of Americans. The poll oddity here is the weight given to independents. 39.6% of the responders claimed to be independent, a figure that is much higher than national registration totals would suggest. However the gap between Democrats and Republicans surveyed by the poll is just over 6%, reflecting a fairly accurate depiction. Recent partisan samples from Rasmussen Reports find Democrats with an advantage of slightly under 7% for instance.
Taking our queue from this particular CBS poll support for the stimulus package seems tied to the view that voters hold of President Obama’s overall job performance. Both have slipped in recent weeks but continue to win over a majority of Americans. Solid economic news from the past couple of days could inspire more confidence in the effectiveness of both, although persistently strong data has proven fleeting thus far in 2009. Simply put, the source of falling support for Obama and the stimulus can be summed up by the saying, “it’s the economy, stupid!”
The CBS poll finds a 48-44% approval to disapproval split in terms of how President Obama is handling the economy. The four-point margin is down from a substantial 22-point divide from just last month. 57% of Americans now approve of Obama’s job performance. While that is down six points after a rocky month of June the decline in support comes from Democrats and independents, not Republicans. An additional 50% expect at least two more years of recession meanwhile. Democratic support for the President has dipped from 92% to 82% over the last month. It seems quite plausible however that a number of disenfranchised Dems may get back on the Obama-Express if and when Judge Sotomayor is confirmed to the Supreme Court.


Independents meanwhile have too shown a considerable drop in support from 58% in early-June to 50% in July. Republican support however is actually up seven-points to 30%. Although the vast majority of Republicans are critical of Obama’s economic policies, he scores considerably better with the GOP in terms of foreign policy and image. 38% of Republicans actually believe the image of the U.S. has improved under the Obama Presidency against just 25% who think it has gotten worse. Solid numbers from the opposition party especially considering how low George W. Bush scored with Democrats when asked the same question.
Cashing in with lukewarm independents, reviving the faith in Democrats and holding steady the support of GOP voters could go a long way in sowing up victories for Democratic proposals and the impending 2010 midterm elections.
One major negative in the continuing PR fight by the Obama Administration is the current pessimism held by Americans. Just 21% think the economy is getting better against 33% who say it is getting worse. That’s down from a positive 27-25% split in June. Still there is faith in the economic stimulus package as the President continues to preach to citizens of its long term impact on growth. In the long run 42% of those polled think the stimulus will render the economy better against 29% who think it will have no impact.
While various polls show that few agree with Oval Office getting to write a blank check, a majority (51%) want the government to have more control of the U.S. financial system. In terms of stimulus’ impact on the federal deficit six in ten would prefer to focus on debt reduction over government spending. By better than a two-to-one ratio however Americans are in favor of short-terms deficit increases to make room for the package.
President Obama has hitched his wagon to the economic stimulus and the numbers reflect that. The fate of his administration and Democrats in general may very well rest in its measurable success or failure over the next sixteen months.

Tuesday, July 14, 2009

Poll: Support for Sotomayor holds steady as Senate hearing commence

READ STORY HERE
The Sotomayor hearings have commenced and it appears likely that they will result in the confirmation of the Hispanic Supreme Court Justice.

Seeking to become the 111th person to sit on the bench of our nation’s highest court Judge Sonia Sotomayor spent Monday in Senate room hearings. Beginning with praising remarks from Judiciary Chairman Patrick Leahy (D-VT), Sotomayor was the subject of a spirited and mostly civil ideological debate between Democrats and Republicans.
The confirmation of the Bronx, NY native as a woman and first Hispanic Judge would mark a groundbreaking moment. It would also be spun as an important victory for President Obama who needs a rebound on the domestic front. This coming after the mostly gloomy economic news and his slowly eroding approval ratings which dominated headlines in June and early-July.

Despite some growing opposition from Republicans and conservative groups and the overruling of her decision by the Supreme Court in the New Haven firefighters case, the views of most Americans remain positive and mostly unchanged from May. According to a just released Gallup survey 53% of voters would like to see the Senate vote in favor of her confirmation to the federal bench. That’s down just a single point since her name first became known in late-May and favorably balanced against just 33% of responders who prefer a “nay” vote.

Rasmussen Reports find that 84% of Americans expect Sotomayor to win confirmation. Overwhelming numbers such as this create an air of inevitability surrounding the process and may make it difficult for outnumbered Senate Republicans to effectively keep her from being confirmed. More numbers from Rasmussen suggest that while 45% of voters believe the most important Supreme Court consideration is the nominee’s legal background and competence, a solid minority (27%) think the court should represent the “diversity” of America. Furthermore 23% “think the nominee’s views on important issues should be the priority.”

Gallup meanwhile indicated that Sotomayor’s favorability ratings stand at 38%, with 26% unfavorable and 17% who remain unsure. This is down from 43% favorability in May, up from 21% unfavorable, and down from 21% who were unsure. Rather absurdly meanwhile the Gallup poll found that more adults (19%) have not heard of the Judge in July than in their previous survey in May (15%).

CBS numbers asking slightly different poll questions find that many Americans (39%) have not heard about Sotomayor or are undecided (23%) about their opinions of the Judge. Still by a 30-14% voters are in favor of her confirmation, with a large 52% still suggesting that they “can’t say” with confidence one way or the other.

Returning once more to the Gallup survey we find some interesting numbers that in conjunction with the Democratic Party’s 60-40 Senate seat advantage seem to point to the likelihood that she will be confirmed. Independent support of Sotomayor’s confirmation remains relatively steady between two polls taken in May and July. Support from Democrats has dropped slightly from a 76-6% favorable-unfavorable margin to a 72-15% split. Interestingly enough Gallup finds that in spite of general opposition from Republicans, her favorability has actually improved amongst the party’s voters. Opposition within the GOP holds steady at 57% but those now in favor of a “yay” vote have increased five points to 29% since the May poll.

Sunday, July 12, 2009

Anatomy of a voter through polling


READ STORY HERE
There are many ways to analyze voting behavior. Information gathered giving insight to how certain subgroups tend to vote are essential tools for pinpointing support and shaping one’s message in politics. The difficulty for pollsters however is using the data taken from many variables and then creating a well articulated conclusion.

Take the recent 2008 Presidential election for example. What if we were to ask you to try and figure out whom someone you do not know voted for in the last election through a series of ten basic questions and observations regarding their physical, social and ideological makeup?

Meet Jon Gonzalez. Our new friend patiently answered a number of questions that helped us create a solid profile of who he is and what he believes. Here is a list of those ten questions, what Jon answered and the likelihood that he voted for either then Senator Barack Obama or John McCain.


1) Party Identification: Independent (Obama – 54%)

The most clear cut way to figure out how someone likely voted in the 2008 Presidential Election is to simply ask what their party identification is. Around nine of every ten Democrats were loyal to Barack Obama. Ditto that Republican support for John McCain. Unfortunately for the sake of our investigation Jon Gonzalez is a registered Independent. That means he is part of a grouping that favored Obama by a more modest 54-46% margin head-to-head against McCain.

2) Ideology: Moderate (Obama – 58%)

According to exit polls 44% of American voters claimed to be moderates in the last election. Barack Obama won this group by better than twenty percentage points over John McCain. Combined with what Jon told us about his party identification we can now predict with 58% certainty that he voted for Obama.

3) Gender: Male (Obama – 55%)

This places Jon almost perfectly in the middle of voter preference in the last election. Barack Obama won the male vote in 2008 by an extremely narrow 49-48% margin. Jon’s voter preference based now on three variables is for Obama by a 55-45% margin.

4) Race/Ethnicity: Latino (Obama – 59%)

Jon is Latino, a subgroup who voted for Obama nearly 67% of the time. He is also a Latino man a group who supported Obama by 64%. Factoring his race into the equation we are now forced to readjust our gender totals. The likelihood that our friend Jon voted for now President Obama is at a new high of 59% after profile question number four.

5) Residence: Missouri, suburban (Obama – 58%)

Living in one of the most competitive swing-states in the country and one with a very small Latino population it’s hard to tell what effect if any living in the Show Me State had on Jon’s vote. McCain won Missouri by just 4,000 votes and the state’s suburban vote by a narrow 51-48% margin.

6) Income: $62,000 (Obama – 61%)

John McCain by a narrow 49-48% margin took the $50-75K bracket nationwide, but again Latino voters supported Barack Obama with income levels ranging across the board. Although not broken down specifically by which race, some 75% of minority voters making more than $50,000 a year voted for the President.

7) Education: College Graduate (Obama – 62%)

Jon was the first college graduate in his family attending the University of Missouri some years ago. By identical percentages to the over-$50,000 income levels non-white college graduates voted for President Obama by a wide 75-22% margin. With just three questions and categories remaining we now can say Jon was a Barack Obama voter with over 62% confidence.

8) Religion: Evangelical Christian (Obama – 57%)

As is the case with the vast majority of Latinos Jon Gonzalez was born and raised Catholic, a religious block of voters who favored Obama by a 54-45% margin. He is however a particularly religious Catholic going to Church at least once a week, a block that showed preference for McCain 55-43%.

9) Military Status: Served (Obama – 56%)

Jon served in as a U.S. Marine two decades ago. Only 15% of Americans according to CNN exit polls in the last election served in the armed forces but John McCain won this block of voters by ten percentage points. After nine categories the likelihood that Jon voted for Barack Obama still hovers at better than 56%.

10) Most Important Issue: War in Iraq (Obama – 53%)

The last of our ten questions for Jon reveals that the most important issue to him as a former military man is the War in Iraq. 59% of the one in ten voters who listed this as their key issue voted for Barack Obama, but Jon also revealed that he at least somewhat supported the U.S. intervention in Iraq, a solid voting block for McCain by 80%.


In summary, by analyzing the typical American voter such as Jon Gonzalez we can see more clearly how President Obama managed to win the 2008 election. Through a series of questions we can conclude that someone with the voter profile of Jon’s favored Obama 53% of the time. Interestingly this is nearly identical to the 52.9% of the popular vote won by Obama nationwide in the last election.

We do however need to guard against the possibility that polling can never tell us everything we need to know about someone. Ten questions create a healthier assessment than four or five, but even more than twenty would not lead us to certainty. The questions a pollster fails to ask can at times be the most important. Jon Gonzalez while registered as an independent for instance has increasingly displayed Libertarian voting tendencies in recent years. In 2008 he sided with neither Barack Obama nor John McCain but was one of the 11,386 Missourians who voted for Libertarian candidate Bob Barr.

Thursday, July 9, 2009

Poll: Is Iraq still a concern with voters?


READ STORY HERE
Hey America! Remember Iraq?


It’s been nearly 6 ½ years since military operations began in the country. While the previous question may sound a bit silly taken literally it does seem clear that our continued involvement in Iraq is a concern placed on the backburner for many Americans.

One of the central themes during the 2004 election cycle was the Iraq War. More specifically the discussion centered around our decision to invade the sovereign nation and justification for pressing ahead or reducing our forces there. With a new administration and party controlling both Congress and residing in the White House however, and the top concern for the vast majority of Americans being our flailing economy, attention has shifted dramatically.

Yet just today we were once more reminded that the struggle in Iraq continues. 60 people were killed in bombings, the worst instance of violence since the United States has withdrawn combat forces from urban areas. As the U.S. focuses more and more on military operations in Afghanistan Iraqi insurgents seem intent on exploiting the lesser presence of troops in their continued effort to destabilize the fledgling democracy.


Polling the American people on their thoughts and feelings regarding Iraq continues meanwhile.


According to exit polling conducted by CNN after the 2004 election some 15% of Americans listed the war in Iraq as the most important issue affecting their vote. That issue ran a competitive fourth in a field where no one topic of concern polled at higher than 22% (moral values). While a majority of Americans in that year’s election concluded even then that the war was going badly for the US, the approval to disapproval split for going to Iraq in the first place was 51-45%.


Four years worth of changes produced vastly different perceptions amongst the American electorate. By Election Day 2008 only 36% of Americans approved with the decision to invade Iraq and the issue itself was most important with just 10% of voters. This is a considerable drop from the 15% polled in 2004 and nowhere near the top concern of voters overall. The economy was the most important issue with a whopping 63% of responders by 2008 and those voters broke an impressive 53-44% in favor of now President Barack Obama.


To date we see little positive shift in the perceptions of Iraq amongst American voters. That said the decision to flee the country completely could be met with a heavy price for Iraqi’s in the eyes of Americans. According to a recent Gallup poll 58% expect conditions to get worse Iraq under the transfer of security from U.S. to Iraqi forces. Nearly seven in ten (69%) also believe that at least some of America’s military forces will remain in the country past the scheduled 2011 withdraw.


The weariness shown by Americans regarding the war perhaps comes through best in a recent CNN poll. Echoing the only 34% of responders who approve with the U.S. intervention in Iraq just 35% think American troops should be sent back to Iraq even if there is a significant increase in violence after the military withdraw.

Finishing the job as stressed numerous times by both the former Bush administration and many high ranking military officials no longer seems to resonate with the majority of American voters. Rasmussen poll results from last week indicate just 16% of voters consider the Iraq war to be over, against 64% who do not. Mirroring the previous CNN poll however only 17% are strongly on board with American troops being sent back into the cities in the event of escalading violence after the withdraw.

Arguments regarding the decision to pull all American troops out of Iraq in 2011 rage onward. Just as the argument for sending troops in the first place continues. For many in the U.S. however as long as major economic problems continue on the home front and other foreign policy concerns take center stage, the Iraq War is something of an after thought. Or at the very least presents an ominous cloud over the head of our country that we seek to dismiss of at all cost.

Wednesday, July 8, 2009

Poll: Reasons for concern and optimism for Sarah Palin upon resignation

READ STORY HERE
Unless you’ve been sleeping under a rock or swept up with grief over Michael Jackson’s recent passing you are probably well aware that Sarah Palin has resigned as Governor of Alaska.

“Palin is Bailin’ on Alaska” and other such smirking catch phrases are being greeted with equal measures of surprise on both sides of the political fence. Many on the Republican side are viewing her decision with shock and disappointment.

What path the soon to be former Governor Palin will choose or where she will land politically speaking rests heavily on her decisions in the coming weeks and months. Both Rasmussen and Gallup/USA Today meanwhile have gotten the jump on some polling to give a sense of what the electorate thinks about the woman and her unusual decision at present.


Recently polling a thousand individuals the results of the Gallup/USA Today survey suggest there are both reasons for concern and relief in Palin-Camp. 43% suggested that they are either “somewhat” or “very” likely to cast their vote for Sarah Palin in the event that she decides to run for President in 2012. While the poll does not go into depth on her chances of surviving a hypothetical field of Republican competition in that year’s primary it does help to suggest that there is a substantial pool of support for the former Governor.

On the other side of the coin however 54% suggest they are not likely to vote Palin in 2012 and even worse for Sarah are the number of those strongly against her (41%) more than doubling the number who would appear strongly for her (19%). Republicans show solid support for Palin but Democrats are aligned heavily against her. Furthermore the number of independents not likely to vote for Sarah as a candidate outnumbers those who would by a solid 53-44% margin.

Another positive coming for Palin supporters in this Gallup/USA Today poll may be the number of Americans who say their opinion of the Governor has not changed even with her resignation announcement. 70% are seemingly unfazed by this although those who now view her less favorably out number those who view her more favorably by a 17-9% margin.

It must be noted however that according to polls taken in recent months Palin’s favorable rating amongst Americans was not exactly stellar. In May CNN showed her drawing a 46-43% split between those with a favorable to unfavorable opinion, and Pew Research Center backed that up with a mid-June poll that suggested an even narrower 45-44% split.


Rasmussen Reports finds Sarah Palin’s decision to resign aiding to the further polarization of her image amongst the Republican Party and with voters nationally. She is running a competitive second amongst six prominent GOP potentials when the question of who Republicans would vote for in the 2012 primary. Her 24% support currently trails Mitt Romney by a single-point and is two-percentage points ahead of Mike Huckabee.


When asked the question of who they would “least” like to see win their party’s nomination however Palin ties Mississippi Governor Haley Barbour at 21% among Republican voters. Furthermore a plurality of Republicans (40%) think Palin’s resignation has hurt her chances at winning the party nomination in 2012 if she intends to seek it. 24% actually think the decision will boost her prospects, with another 28% saying it will have no impact.

It will be interesting to track what are sure to be more polls following the progress of Sarah Palin over the coming weeks and months. Barring what would be a surprise announcement that she is not in fact seeking nomination in three years, it should be quite entertaining as we move forward to watch Palin as she continues spar with the media, looks to court voters and restore her imagine with many in the Republican Party.

Monday, July 6, 2009

Poll: Latest social and political trends in Pennsylvania

Read Story Here
Franklin & Marshall College has become one of more relied upon pollsters for all things politics in the state of Pennsylvania. While it’s easy to get the National facts and figures from heavyweight publications like Gallup, Rasmussen, Quinnipiac or the major networks, newspapers and magazines, current and accurate state-by-state analysis in off-election years is difficult to come by.

Polling on a series of topics Franklin & Marshall recently released their June roundup on Pennsylvania. Below are a list of ten of the more important and interesting results, aspects and trends from this latest survey of 580-Pennsylvanians.

1) Results Skewed Towards Democrats

Of the 86% of responders in this poll who said they were registered to vote, Democrats outnumbered Republicans and independents by a 52-36-8% margin. This is an exaggerated total from CNN exit polling following the 2008 Presidential election where Democrats outnumbered Republicans and “others” by a more modest 44-37-18% margin.

2) Direction of Pennsylvania

Residents by a narrow percentage (48-44%) think Pennsylvania is heading in the wrong direction overall. There is slightly more optimism than when the same question was asked in February but the number of those who think the Keystone State is heading on the right track is down from the most recent March poll.

3) Personal Finances

Residents of Pennsylvania are feeling far worse about their personal income than they did a year ago. Although 45% said they are about the same financially as in 2008, by a nearly 4-to-1 ratio people say they are worse off than better off from this time last year. It has been exactly seven years since Pennsylvanians have felt financially better off currently than a year prior (29-20% - June 2002).

4) Finances a Year from Now

In spite of the economic weariness the Franklin & Marshall poll suggests more Pennsylvanians (32%) have a positive than negative financial outlook (21%) looking forward a year from now. It is worth pointing out however that at no time since this poll began in April of 1995 did more responders say they thought they would be financially worse off than they were at the present.

5) Specter Job Performance Ratings

President Obama, Governor Rendell and Senator Arlen Specter have all seen declines in their performance ratings since the last Franklin & Marshall poll in March. Specter’s numbers in particular have declined at an alarming rate since his party-switch. He is now viewed positively by 34% of Pennsylvanians, down eighteen-points from March. His negatives amongst Republicans are staggering and nearly half of Pennsylvania Democrats are undecided who they will support in this year's Senate primary.

6) Confidence in Obama Still High

Barack Obama has seen his approval ratings dip in most areas nationally and in Pennsylvania alike, but confidence in the President is still high amongst Pennsylvanians. 66% say they are either somewhat or very confident the President can handle the country’s economic problems. Only 19% of Pennsylvanians grade Obama’s overall job performance as “poor”, against 55% who say he has been “excellent” or “good”.

7) Negative Views on “Quality of Government”

Pennsylvanians are not impressed by the quality of their overall state government. More say it is “poor” than “excellent” by a 18-3% margin and there is a 48-29% favoring those who say it is “fair” rather than “good”. 29% of Pennsylvanians want increased taxes to help balance their state’s budget deficit, but 44% favor cutting programs and services to achieve efficiency. More than a quarter (27%) of responders remain either “uncertain” or “don’t know”.

8) Music Listening Habits

Pennsylvanian’s list rock (24%) and country (21%) as their two favorite forms of music. The list of response choices included rock, country, classical, R&B, pop, jazz, hip-hop and punk. Taking out of the equation the 20% of responders who favored none of the eight aforementioned forms of music or did not agree with the labels associated with them, rock or country were the majority selection, over 56% listening either as their favorite genre/format.

9) Pennsylvania Pro-Choice, Pro-Bible

Over three-quarters (76%) of Pennsylvanians agree that abortion should be legal in most or all cases. This is fairly consistent with results throughout the decade with a 76-80% range of Pennsylvanians polled each year favoring the legality of abortion. Also consistent are religious views on the teachings of the Bible dating back to 2004 results. 25% think the Bible is the actual word of God, with an additional 56% believing it to be the inspired word of the Lord even is every aspect should not be taken literally.

10) Pa. Similar to National Ideology

The numbers of Pennsylvanians who identify as liberal, conservative and moderate is similar to the number of Americans who view themselves as such. Since this poll began analyzing social/political ideology in 1999 a range of 15-22% of Pennsylvanians have labeled themselves liberal and 29-39% as being conservative. Currently those figures are 19% and 37% respectively. Interestingly the Franklin & Marshall poll suggests a decade low-point for self-identifying moderates with just 34% thinking of themselves as middle of the road. That total is down a highly questionable seven percentage-points from just this February and from a high of 52% in September of 2004.

Saturday, July 4, 2009

Poll: 62% say Fourth of July is one of the most important American holidays

Read Story Here
Happy Fourth of July 2009!

In celebration of our independence day Rasmussen Reports has released the results of their annual polling on the topic of all things July 4th. Positive nationalist feelings seem to be on the rise in 2009 in spite of these struggling economic times, uncertain future and an electorate increasingly at odds with one another.

In the Philadelphia area we take special pride in the celebration of this holiday as the true birthplace of America. Likewise it seems the majority of our fellow countrymen agree with that sentiment. Up four points from last year 62% of Americans now view the Fourth of July as on of our country’s most important holidays. This is a 4% increase from the same poll taken in 2008. A miniscule 4% feel it’s one of our nation’s least important holiday’s, while nearly one-third (32%) think it ranks somewhere in between.

There is a small divide between genders with men considering July 4th more important than women by a 66-59% margin. The gap is a bit larger between political parties however. 73% of Republicans against 57% of Democrats and unaffiliated voters are sold on the 4th being one of America’s most important holidays.

When grading our Founding Fathers 32% of Americans consider George Washington to be the greatest of group. Thomas Jefferson and Benjamin Franklin rank second and third with 26% and 22% respectively, with the second U.S. President John Adams (7%) and James Madison (3%) a distant fourth and fifth. One in ten Americans are undecided on who is the greatest Founding Father according to the poll.

Earlier in June Rasmussen ask similar questions regarding the Constitution. 83% of Americans consider the central document to be either good or great, but more specific questions garner interesting results. Just 10% of poll responders think the Constitution places too much restriction of what our government can do against 44% who feel it does not do enough, and 38% considering it to be just about right. Perhaps in response to certain scandals and the numerous spending bills brought forth by the Obama administration there has been a 5% increase from a year ago of those feeling the Constitution does not do enough to restrict government.

More than half of Americans (54%) believe our country to be a nation of “liberty and justice for all” to this day, with 82% stating they’d rather live in America than any country in the world if given the choice to move anywhere.

Finally a number of opinion polls through the years have been done on the topic of who Americans feel was the greatest or worst President.

A 2000 ABC poll ranked fourteen Presidents who garnered at least 1% of support. Abraham Lincoln came in first place with 19% of the total followed by 17% for John F. Kennedy, 11% for Franklin Roosevelt and 9% for Ronald Reagan. The results of a Washington College poll from 2005 closely mirrored those results; Lincoln (20%), Reagan (15%), Roosevelt (12%) and Kennedy (11%) ranked first through fourth. More recently a Gallup survey from 2007 again had the four aforementioned President’s in the top five with Bill Clinton who ranked fifth in the Washington College poll climbing to fourth in Gallup’s study.

Rasmussen in 2007 decided to rank each President in terms of their historical “favorably-viewed” rating. Not surprisingly George Washington (94%) and Abraham Lincoln (92%) finished first and second. Thomas Jefferson, Theodore Roosevelt, Franklin Roosevelt and John F. Kennedy were next on the list each pulling in an at least 80% favorable. Rounding out the top-11 with 70-79% favorable ratings are John Adams, James Madison, Ronald Reagan, Dwight Eisenhower and Harry Truman. Bill Clinton (55%) ranked 20th on the list with Richard Nixon and George W. Bush scoring the highest unfavorable ratings of any two Presidents.

Rounding out the surveys is a 2006 Quinnipiac poll asking 1,534 registered voters who they considered to be the worst President of the eleven who have served since World War II. George W. Bush was voted the worst by a whopping 34%, with Richard Nixon a distant second (17%), the polarizing Bill Clinton third (16%), Jimmy Carter fourth (13%) and no other President breaking the five percentile.

Have a happy and safe holiday everyone!

Friday, July 3, 2009

Poll: Attacks on Sotomayor may result in only minimal damage for GOP with Hispanics

Read Story Here
A host of new polling data compliments of Quinnipiac University paints an interesting picture on the topic of the GOP's standing with the Hispanic community.

While high court partisan drama is a typically part of the political process, the Sonia Sotomayor nomination is being treated as something more than the standard party and presidential barometer. President Obama's desire to place the first Hispanic judge on the Supreme Court is notable in a history making sense just as it seems noticeable in subtle demographic positioning. Many pundits have suggested that attacks levied by the GOP could further erode the party's support with the key group of Hispanic voters.

Not a rosy outlook to be certain for a party in need of win. The question is now whether the facts back up the gossip. According to at least one polling outlet the answer is probably no.

Respected pollsters like Quinnipiac, Gallup, Associated Press and USA Today amongst others have Judge Sotomayor's approvals pegged in the mid to upper-50 percentiles. But it's a deeper look into the Quinnipiac numbers in particular that could spell some measure of relief for the Republican Party. According to a recent poll Sotomayor's overall approval of 55% is, surely to the surprise of many, just three percentage points lower than her support within the Hispanic community.

The poll finds that sub-groupings such as African-Americans (85%) and women overall (60%) rate the judge higher than her own ethnic community. Data such as this hints at the possibility that the GOP may not be risking as much with a full out attack on President Obama's nominee as previously believed.

Of course a swift confirmation process is a political victory for any President, but placing Sotomayor on the bench may not have the sort of positive residual effects many Democrats may have been searching for. One particularly interesting poll question by Quinnipiac to its nearly 3,100 responders asked whether it be important for the body of the Supreme Court to “better reflect” that of the country as a whole. This question was in terms of race, ethnicity, gender and religion as compared to a judge's legal qualifications. Only 8% found it to be a more important aspect to the makeup of the bench against 57% who found it less important than individual merit. Nearly a one to seven ratio.

Such findings go hand in hand with the concept that racial biases for and against candidates of high positions in government are, quite possibly, beginning to fade in terms of relevance. Its worth mentioning that Sotomayor enjoys nearly identical support at this point in her confirmation process as that of the average combined ratings of the last four confirmed Supreme Court nominees; Clarence Thomas, Ruth Bader Ginsburg, John Roberts and Samuel Alito.

Perhaps as the Huffington Post points out, Sotomayor's clout and vulnerabilities as a candidate rest much more so in her political ideology than her ethnicity. Hispanics as a whole lean towards the Democratic Party but it's questionable to what extent they are liberal socially.


When asked whether Sotomayor "is more liberal than you would like" for a Supreme
Court justice, a quarter of Hispanic respondents responded, "yes." Only 11% said
that Sotomayor is "not liberal enough," while 46% said that her position on the
political spectrum is "about right." - Sam Stein / Huffington Post


Still it remains unsurprising that the Hispanic/Latino block of voters is so targeted. Major net gains by either party with this ever-growing group in the future could go a long way in deciding elections. That a popular Hispanic judge makes history by getting named to the Supreme Court however brings into question whether the political needle shifts anymore to the left.

Latino's at present make up roughly 9% of the voting pool. It's obvious that Republicans still reeling from crushing defeats in November and the 2006 congressional elections have lost considerable support with that group. Barack Obama won 67% of the Latino vote in 2008 up fourteen points from John Kerry's showing as the Democratic Presidential nominee four years earlier.

President Obama netted somewhere between 1.5 - 2 percentage points nationally from that increase in Latino support alone. Had Kerry done as well with Latino’s as Obama he may have been elected President. Such a swing is perhaps critical to the Democrats chances of winning not only close future elections on a national level but also within key swing-states.

Here in Pennsylvania President Obama by a margin of 72-28% took Latino vote in the last election. The Keystone State still garners battleground status in elections. With its relatively small number of Latinos however there may not be much more ground the Democrats can pick up. Ditto similarly important swing-states such as Ohio and Virginia where the figures for Latino voters do not top 5%.

All eyes then focus on Florida and the Sunbelt region where the GOP lost considerable ground in 2008. The more modest 57-42% margin of victory for Obama in Florida amongst a large number (14%) of Latino voters could keep the Sunshine State in the blue column for years to come. This in the event of an increase of Democratic support within the Hispanics community. The President's overall margin of victory here was by less than three-points, but the latest poll numbers involving Judge Sotomayor do not point towards a bump for the Dems in Florida or much of anywhere else.

Sonia Sotomayor has an opportunity to make history. But whether she will change the future in a positive way for Hispanics in the Democratic Party is highly questionable.

Polling health care reform - a dodgy proposition

Read Story Here
Earlier this month when 800 registered voters were asked the question of whether they’d support or oppose enacting a major overhaul of the U.S. health care system, by a margin of 62-28% the answer was a resounding yes.


Those were the results from a recent Diageo/Hotline poll, and they are positioned quite nicely for those proponents of full-scale heath care reform. Of those “yes” responses an additional 94% feel it is at least “somewhat” important that the government pass major reform legislation before the end of this year. Numbers such as these seem to point to an ever-growing majority of American voters who are seeking a change in our culture of medical care.


Now what exactly do these numbers mean, and how much stock should we place on polling an issue such as health care? An issue with complexities and variables that beg of thoughtful discussion over a series of often narrow and tapered questions.


Major policy initiatives often sink or swim based on public perception. There is yet another culture war brewing and both sides are gearing up their data and rhetoric for battle. So far it is the Obama administration that appears to have the upper hand. Never mind the President’s built-in advantages compliments of a sweeping November mandate and control of congress. Health care reform is a fight for the hearts and minds of the American people.


Charismatic leader of the free world in public but a shrewd pragmatist behind closed doors, President Obama knows as well as anyone when gains with the electorate are available for the taking. Looking further down the list of questions from this Diageo/Hotline poll we find some other interesting results. By a margin of 65-21% responders said they would be more likely to vote for a candidate in the 2010 midterms who supported health care cost controlling legislation.


More illuminating still was a question asking whether you would support taxing benefits in order to pay for the cost of expanding coverage. 68% were opposed to such a measure. President Obama recently backed off a campaign promise to tax such benefits received from health insurance plans. Could the overwhelming majority of the public siding against such a proposal be reason for the President’s switch? Don't bet against it.


The heated discussion involving health care reform is of particular importance to many Pennsylvanians. A week and a half ago KYW 1060’s Steve Tawa reported on Senator Bob Casey in a roundtable discussion at the College of Physicians in Philadelphia. The Democratic Senator is heeding President Obama’s concern on the issue. Casey commented that he was “alarmed” at findings from a recent Families USA survey that claimed 27.3% of Pennsylvanians under the age of 65 are uninsured.


Rallies orchestrated in the Philadelphia area by organizations such as Health Care for All Philadelphia stress the importance of the issue. Like many others their push is for a “privately financed, single payer health insurance plan.” Health Care for All Philadelphia supports the Family and Business Health Security Act (HB 1660 and SB 400) while claiming that all other bills and measures have served as little more than a band aid on failed insurance system.


Still there are many not onboard with the rallying cries. Leading voices from the political right are looking to strengthen the Republican Party’s position against Obama’s big government practices by offering a dose of straight talk. 990AM conservative columnist Wayne Winegarden acknowledged that while the state of health care is of concern, the Obama plan is not a solution. In addition to criticizing the President’s plan for tax increases Winegarden states that “the experience of countries with single payer systems is not encouraging. Health care costs are contained under single payer systems only by compromising the quality of health care services, denying patients the services they need or want, and forcing patients to endure possibly life threatening lines and delays.”


But it’s the American Medical Association, quarter of a million members strong, that is perhaps best positioned for a fight. Columnist Robert Pear of the New York Times wrote that the A.M.A. has made general statements in the past of how health care ought to be provided through private markets as they are currently. He elaborates on the far more pointed attacks the association is levying against the Obama plan of late however. “The A.M.A. does not believe that creating a public health insurance option for non-disabled individuals under age 65 is the best way to expand health insurance coverage and lower costs. The introduction of a new public plan threatens to restrict patient choice by driving out private insurers, which currently provide coverage for nearly 70% of Americans.”


Siding with both views are the results from a nearly three-month old CNN poll reviewed by their Deputy Political Director Paul Steinhauser. More than 80% of the 1,019 polled claimed to be satisfied with the quality of health care they receive and three-quarters are happy with their overall coverage. However, when asked about the cost of health care more than 75% say they are dissatisfied.


When Americans say they support health care reform, that doesn't mean they want
to lose their own coverage or give up their own doctor. That's something that
the Clinton White House didn't realize in 1993. – CNN Polling Director / Keating
Holland


Herein lie the complexities of polling on an issue such as health care reform. Pollsters like Diageo/Hotline while responsible in their presentation fall short of capturing the full scope of positions and range of opinions regarding this hot-buttoned issue. What side of the fence does public opinion sit on regarding health care reform? The answer is subject to change depending on who is asking the questions and which side is winning the PR war.